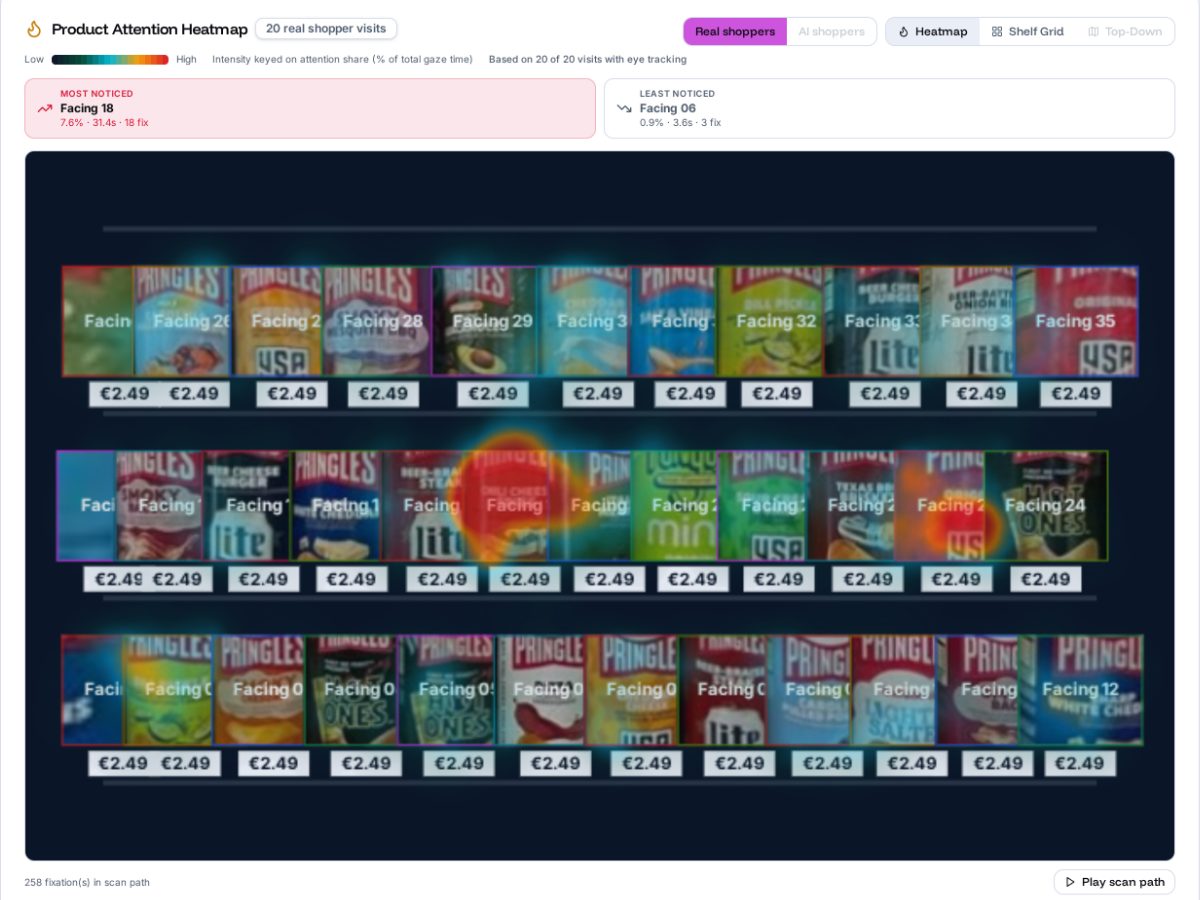
Attention
Webcam gaze mapped onto the shelf you photographed. Camera frames never leave the shopper’s laptop.
Attention, behaviour and decision at the shelf, not opinions.
Webcam gaze mapped onto the shelf you photographed. Camera frames never leave the shopper’s laptop.
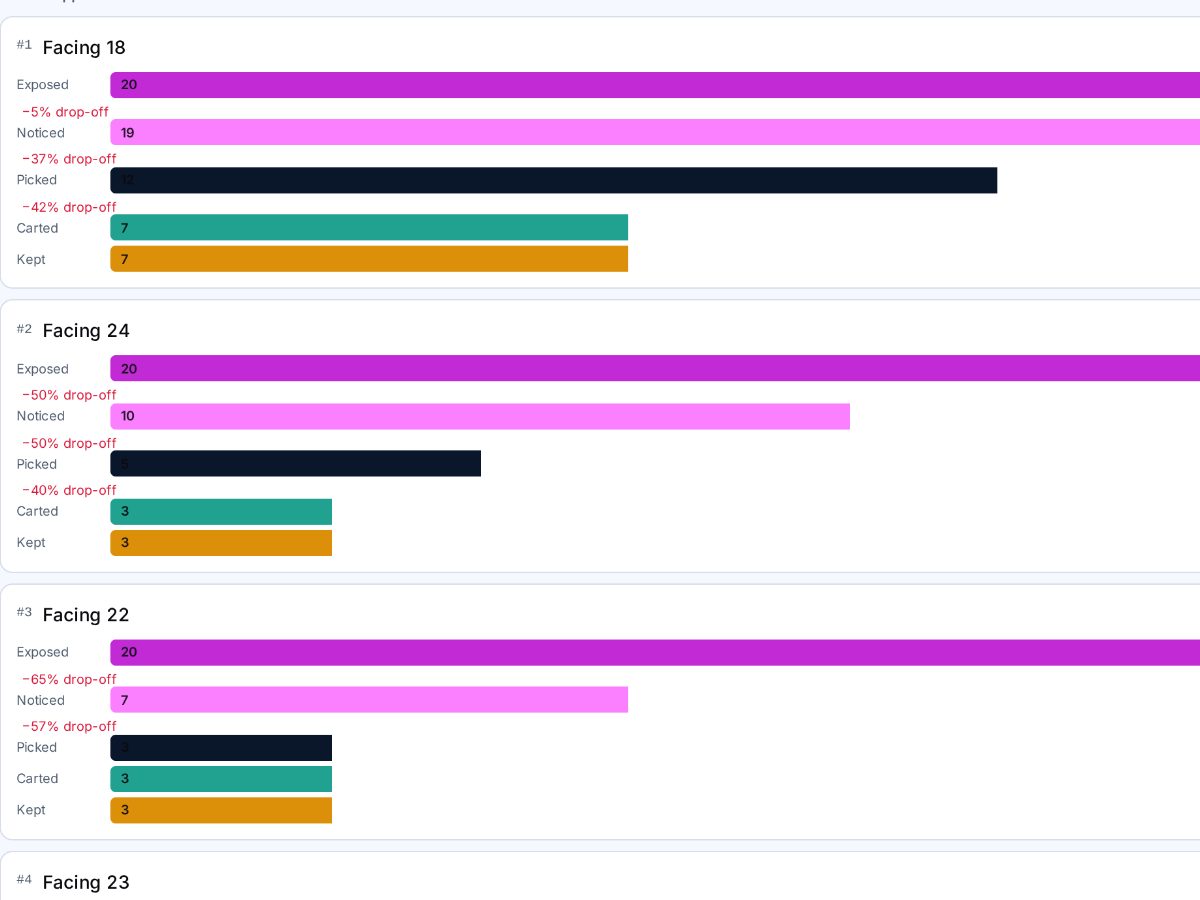
Noticed, picked up, put back, carted, kept. Logged during the walk, not recalled afterwards.
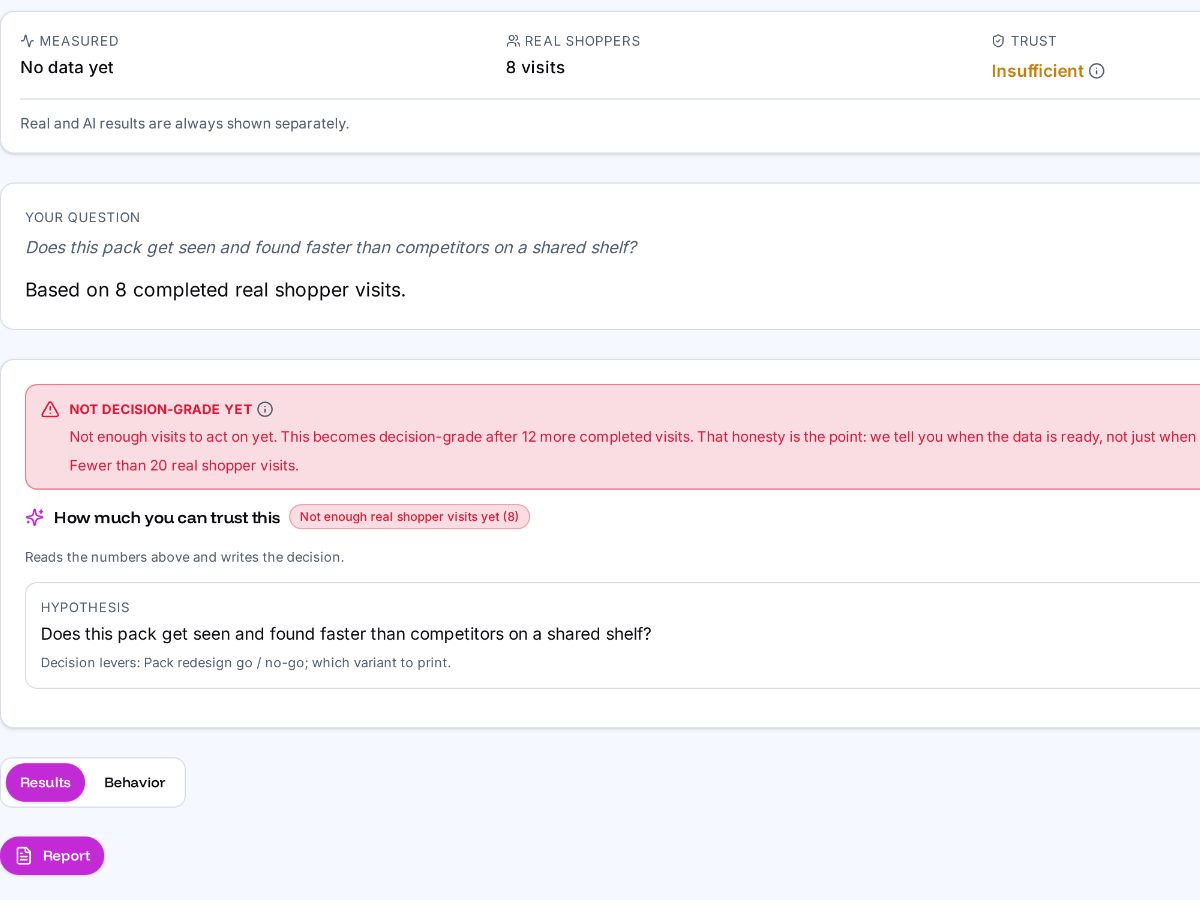
Choice share per version with its margin, and the why from your tasks and a short survey.
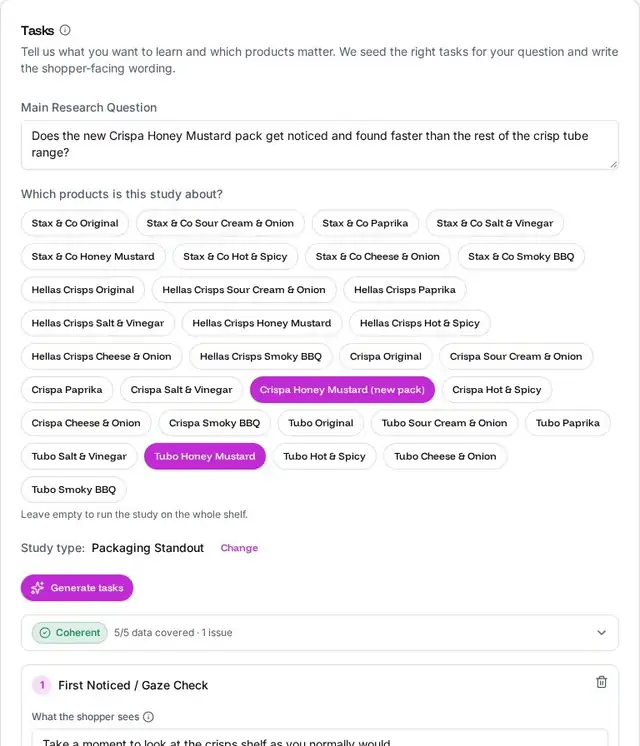
Built with the researcher, so every protocol matches what the study needs to answer.
Write the research question and pick the products that matter.
Packaging, shelf, price, assortment and more. Each type seeds the tasks its question needs.
A fixed four stage script: practice, free shopping, directed tasks, questions. The AI writes inside locked slots.
Every task maps to a measure, and the script is checked for coherence. Edit anything you like.
Our team has collected and analysed data from 800+ consumer tests in reconstructed shopping environments, with global FMCG and retail brands.* Three examples, clients anonymous.
Seconds to find the product
Found faster next to wafers, and 50% of shoppers file the bar under a different category than its shelf.
n = 26 shoppers · 2 shelf versions · with a national grocer
Purchases of the focal brand
Price thresholds per SKU without an in store test. Competitors took 13 to 16 purchases per ladder.
n = 36 shoppers · 3 shelf versions
Seconds of attention per pack, lab eye tracking
The angular bottle won on attractiveness but not on purchase intent. The unmet need: a pump.
n = 30 women aged 25 to 45 · 6 brands
* Proven at 26 to 36 shoppers per study for planogram, price and pack decisions. TestCart AI shows the margin of every figure and stamps a report decision grade only when its key comparison is settled.
We do not predict sales volume.
Real and simulated shoppers are never merged into one figure.
Webcam gaze is never presented as equal to lab eye tracking.
Decision grade only when the key comparison is settled.
Or open the example report first.
We use analytics cookies to see which pages help. No ads, no tracking across sites. Privacy